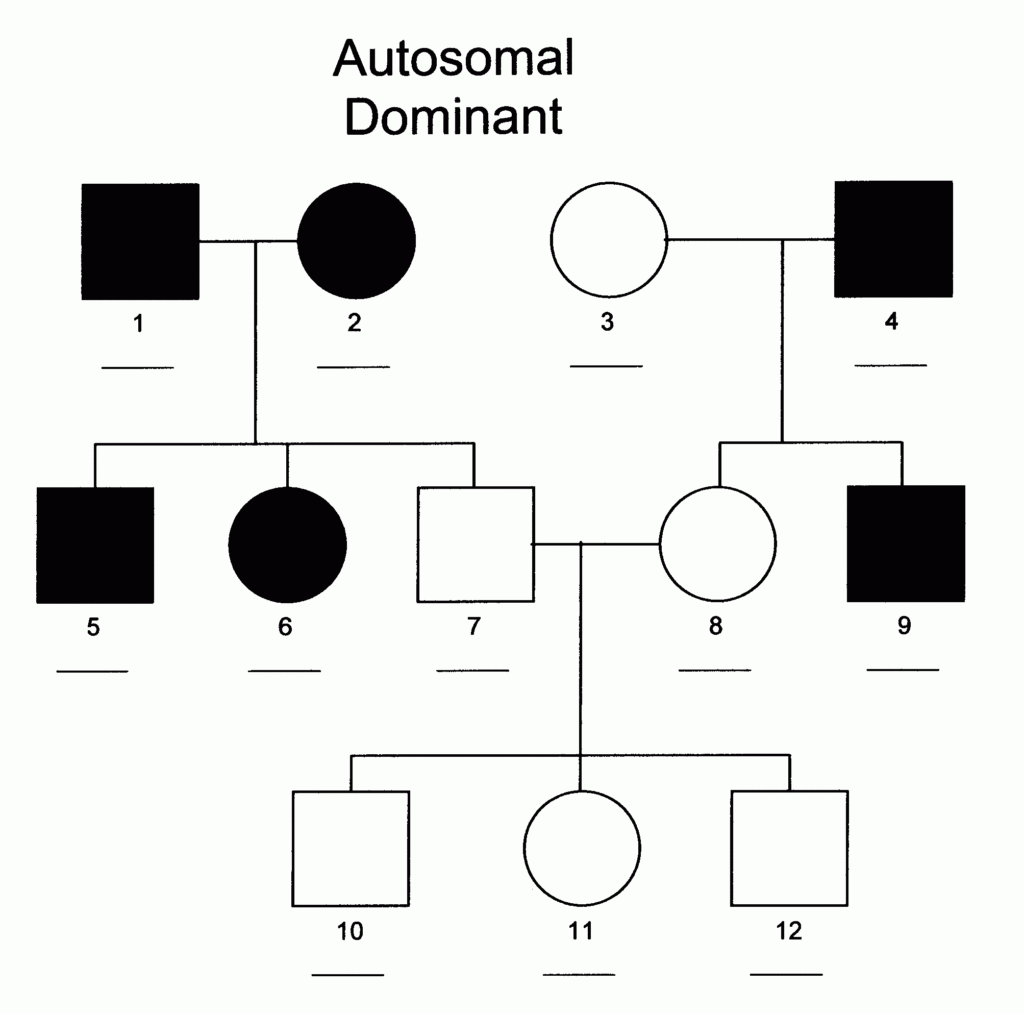
When studying genetics in freshman level biology, one important tool that is often used is the pedigree flow chart. These charts provide a visual representation of how traits are passed down through generations in a family. Each symbol in the chart represents a different family member, and lines connecting the symbols show relationships between them. By analyzing these charts, students can gain insight into the inheritance patterns of specific traits within a family.
When interpreting a pedigree flow chart, it is important to pay attention to key symbols and patterns. For example, squares typically represent males, while circles represent females. Shaded symbols indicate individuals with a particular trait or condition, while unshaded symbols represent individuals without the trait. Understanding these basic symbols can help students navigate through the chart and identify patterns of inheritance.
Interpreting A Pedigree Flow Chart For Freshman Level Biology
Identifying Inheritance Patterns
One of the main goals of interpreting a pedigree flow chart is to identify the inheritance pattern of a specific trait within a family. There are several common inheritance patterns that can be observed in these charts, including autosomal dominant, autosomal recessive, and X-linked inheritance.
In an autosomal dominant inheritance pattern, individuals who inherit a single copy of the dominant allele will exhibit the trait. This means that affected individuals will have at least one affected parent. On the other hand, in an autosomal recessive inheritance pattern, individuals must inherit two copies of the recessive allele to exhibit the trait. This often results in unaffected parents who are carriers of the trait.
Applying Pedigree Analysis
By analyzing pedigree flow charts, students can apply their knowledge of inheritance patterns to predict the likelihood of a specific trait being passed down within a family. This type of analysis can be useful in understanding genetic diseases, as well as in breeding programs for plants and animals. It allows students to make informed predictions about the likelihood of certain traits appearing in future generations based on the patterns observed in the pedigree chart.
Overall, interpreting a pedigree flow chart is an essential skill for students studying genetics in freshman level biology. By understanding the symbols and patterns present in these charts, students can gain valuable insight into how traits are inherited within families and apply this knowledge to real-world scenarios.
