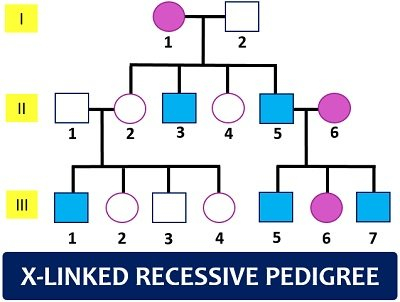
A pedigree chart is a visual representation of a person’s family history. It is typically used in genealogy to track and display the relationships between individuals across multiple generations. Each person is represented by a box, with lines connecting them to their parents, siblings, and children. The chart can also include additional information such as birth dates, marriage dates, and death dates.
By studying a pedigree chart, you can gain insight into your family’s genetic makeup, health history, and lineage. It can help you identify patterns of inheritance for certain traits or diseases, and uncover hidden connections between relatives. The chart provides a clear and organized way to document and analyze your family tree.
The Pedigree Chart Represents
Key Components of a Pedigree Chart
There are several key components that make up a pedigree chart. These include:
1. Generations: Each horizontal row represents a different generation, with the oldest generation at the top and the youngest at the bottom.
2. Symbols: Different symbols are used to denote gender, relationships, and other important information. For example, squares represent males, circles represent females, and lines connect parents to their children.
3. Relationships: The lines connecting individuals on the chart indicate their familial relationships. A solid line represents a biological relationship, while a dashed line may indicate an adopted or step relationship.
Using Pedigree Charts for Research
Pedigree charts are valuable tools for genealogists, genetic counselors, and medical professionals. They can be used to trace hereditary conditions, identify potential genetic risks, and confirm relationships between individuals. By carefully analyzing the information presented on a pedigree chart, researchers can uncover valuable insights into family history and genetics.
Overall, the pedigree chart represents a powerful tool for documenting and understanding family relationships. Whether you are exploring your own ancestry or studying genetic inheritance, this visual representation can provide valuable insights and help you make connections that may have been previously unknown.
