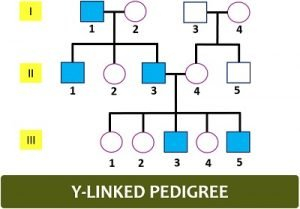
A pedigree chart in biology is a diagram that shows the genetic relationships within a family. It is commonly used to trace the inheritance of specific traits or genetic disorders through multiple generations. Each individual in the chart is represented by a symbol, with connections indicating familial relationships and patterns of inheritance.
These charts are often used in genetics research to analyze the transmission of genetic traits and to predict the likelihood of certain traits appearing in future generations. By studying pedigree charts, researchers can better understand the genetic basis of various traits and diseases.
Pedigree Chart Biology Definition
How to Interpret a Pedigree Chart
Interpreting a pedigree chart involves understanding the symbols used and the patterns of inheritance displayed. Common symbols include squares for males, circles for females, shaded symbols for individuals with a particular trait or disorder, and lines connecting parents and offspring.
Patterns of inheritance, such as autosomal dominant, autosomal recessive, X-linked dominant, and X-linked recessive, can be identified by analyzing the distribution of traits within the chart. By examining the relationships between affected and unaffected individuals, researchers can determine the mode of inheritance for a particular trait.
Conclusion
In conclusion, a pedigree chart in biology is a valuable tool for studying the inheritance of genetic traits within families. By analyzing these charts, researchers can uncover patterns of inheritance, identify carriers of genetic disorders, and make predictions about the likelihood of certain traits appearing in future generations. Understanding how to interpret pedigree charts is essential for genetic research and can provide valuable insights into the genetic basis of various traits and diseases.
